echarts柱状图使用配置
1、认识、引入和使用
先来看看我们柱状图是什么样子:
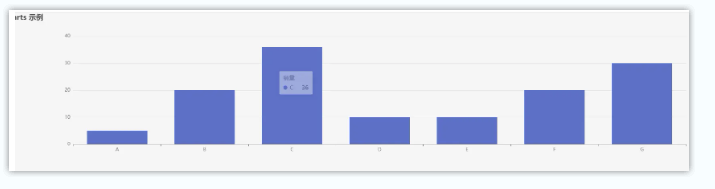
柱状图的使用跟我们的echarts折线图差不多,只不过我们在echarts折线图文章之中进行了大量的铺垫 习惯了echarts折线图的使用以后,使用我们柱状图就轻而易举了
👉** 引入**
这里我们依然是采用echarts5 之中的写法,echarts4可以看看我关于echarts的折线图的文章部分
javascript
import * as echarts from 'echarts';// 5.4区别4引入方式👉** 使用**
这里使用部分也是跟我们折线图的部分差不多,甚至不想看的可以直接跳过就可以了!
javascript
<div ref="chartRef" style="width: 100%; height: 400px;"></div>javascript
<template>
  <div ref="chartRef" style="width: 100%; height: 400px;"></div>
</template>
<script setup>
import { onMounted, ref } from 'vue';
import * as echarts from 'echarts';

// 创建对 DOM 元素的引用
const chartRef = ref(null);

onMounted(() => {
  // 在 DOM 挂载后初始化 ECharts
  const chart = echarts.init(chartRef.value);

  // 设置图表的配置项和数据
  const  option = {
  xAxis: {
    type: 'category',
    data: ['Mon', 'Tue', 'Wed', 'Thu', 'Fri', 'Sat', 'Sun']
  },
  yAxis: {
    type: 'value'
  },
  series: [
    {
      data: [120, 200, 150, 80, 70, 110, 130],
      type: 'bar'
    }
  ]
};

  // 使用配置项和数据显示图表
  chart.setOption(option);
});
</script>
<style scoped>
/* 可以根据需要添加样式 */
</style>
然后我们看看我们的效果
这里可以看到我们已经基本把柱状图写好了,接下来就可以调整细节了
2、详细使用(基本参数)
👉柱状图颜色
- 柱子渐变 series -> color 通过series中的color进行更改
官网之中我们可以详细看到这个配置项
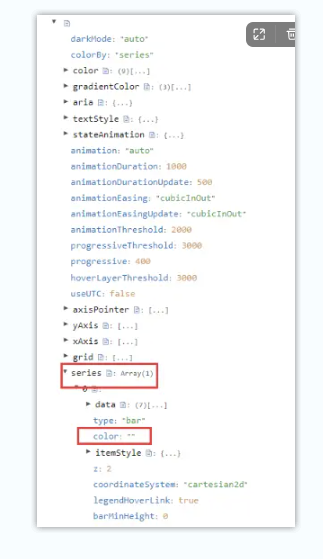
更改柱子为渐变色
这边我们尝试一下更改
javascript
  // 线性渐变,前四个参数分别是 x0, y0, x2, y2, 范围从 0 - 1,相当于在图形包围盒中的百分比,如果 globalCoord 为 `true`,则该四个值是绝对的像素位置
 color: {
        type: 'linear',
        x: 0,
        y: 0,
        x2: 0,
        y2: 1,
        colorStops: [
          {
            offset: 0,
            color: 'red' // 0% 处的颜色
          },
          {
            offset: 1,
            color: 'blue' // 100% 处的颜色
          }
        ],
   global: false // 缺省为 false
}
然后看看我们更改以后的效果
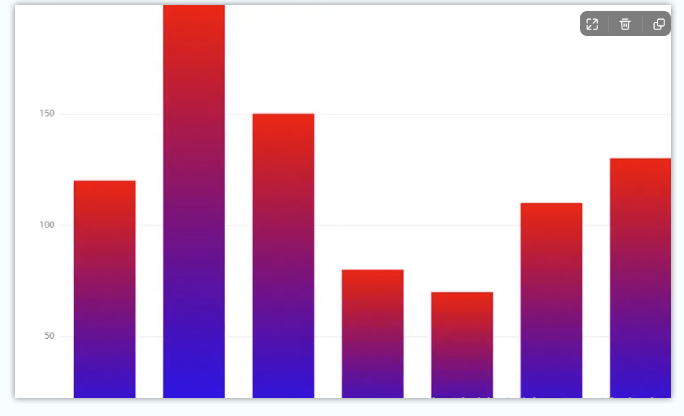
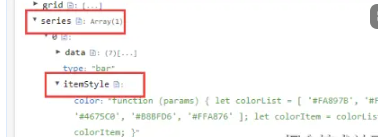
五个柱子分别显示不同颜色
上面我们写的柱子里面都是同一种渐变色,现在有个需求,就是需要五个柱子分别展示不同的五种渐变色,那么这个时候我们应该如何写呢**在series**中有**itemStyle**属性,该属性支持使用回调函数,使用echarts中自带的渐变色对象返回相关对象 利用series中的itemStyle参数
plain
markdown

  > LinearGradient中的参数前四个参数分别代表
x : 从左向右 1 ——> 0
y:从上向下 1 ——> 0
x2:从右向左 1 ——> 0
y2:从下向上 1 ——> 0
如果想要左右效果的渐变,那么只需修改x->x2即可
👉** 然后我们进行一下相对应的更改尝试一下:**
javascript
  return new echarts.graphic.LinearGradient(0, 0, 1, 0, [{ // x->x2
      offset: 0,
            color: colorItem[0]
        },
        {
            offset: 1,
            color: colorItem[1]
        }
   ], false);
具体就是这里这个参数
javascript
  itemStyle: {
    normal: {
      color: function (params) {
        let colorList = [
          '#FA897B',
          '#FFDD94',
          '#D0E6A5',
          '#FFDD94',
          '#4675C0',
          '#B8BFD6',
          '#FFA876'
        ];
        let colorItem = colorList[params.dataIndex];
        return colorItem;
      }
    }
}
这里我们可以看看最后的效果
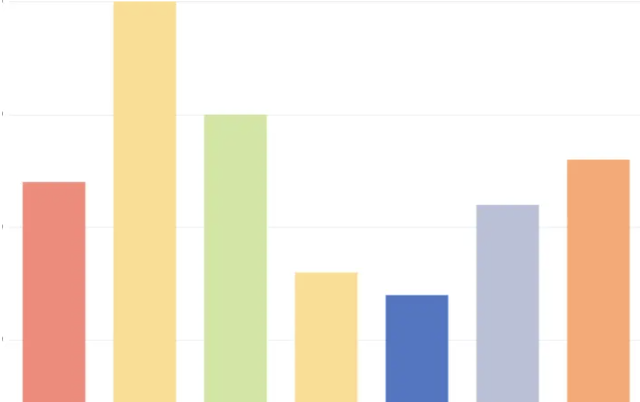
分别显示不同的渐变色柱子
利用itemStyle中的normal color回调函数返回一个渐变色
javascript
itemStyle: {
normal: {
color: function (params) {
let colorList = [
['#FA897B', '#FFDD94'],
['#D0E6A5', '#FFDD94'],
['#4675C0', '#B8BFD6'],
['#86E3CE', '#CCABD8'],
['#64A4D6', '#C782C2'],
['#bdc2e8', '#e6dee9'],
['#FFA876', '#FF5B00']
];
let colorItem = colorList[params.dataIndex];
return new echarts.graphic.LinearGradient(0,0,0,1, //y->y2
[
{
offset: 0,
color: colorItem[0]
},
{
offset: 1,
color: colorItem[1]
}
],
false
);
}
}
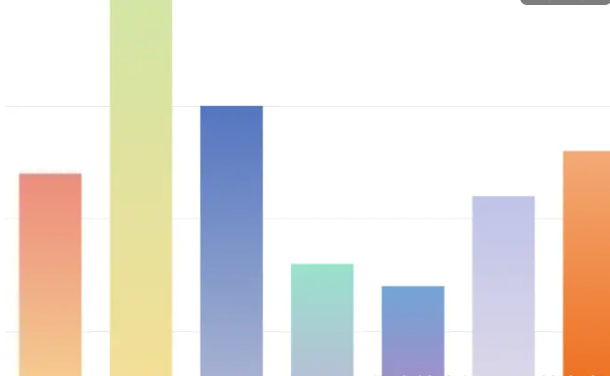
}更改以后的效果
👉柱状图图例legend
javascript
legend: {
  data: ['系列1', '系列2'],
  top: '10%',
  left: 'center',
  textStyle: {
    color: '#000',
    fontSize: 14
  },
  itemWidth: 20,
  itemHeight: 14,
  orient: 'horizontal', // 水平排列图例
},
👉间距grid
plain
grid: {
  left: '5%', //距离左侧边距
  right: '4%',
  bottom: '3%',
  top:"10%",
  containLabel: true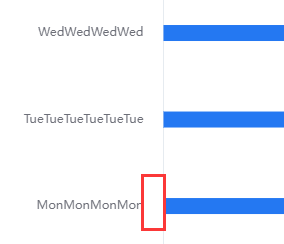
},👉改变分类类型
需要更改雷达图的分类,就更改data数据
javascript
  yAxis: [
        {
            type: 'category',
            axisTick: {
                show: false
            },
            data: ['周一', '周二', '周三', '周四', '周五', '周六', '周日'],
            axisLabel:{
                fontSize: 100,  //控制字体大小
            },
        }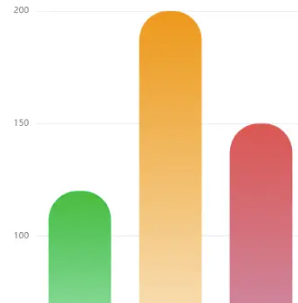
],👉设置四个圆角的半径
设置 barBorderRadius 属性,可以分别设置四个圆角的半径。
在数组中,依次表示左上角、右上角、右下角、左下角的圆角半径。通过调整这些数值,可以达到自定义圆角样式的效果。
javascript
  option = {
    // 其他配置项...
    series: [{
        type: 'bar',
        data: [10, 20, 30, 40, 50],
        itemStyle: {
            borderRadius: [5, 5, 0, 0] // 设置四个圆角的半径,顺序为左上、右上、右下、左下
        }
    }]
};
更改以后的效果
设置柱状图顶部显示数字
通过设置 label 属性来实现柱状图内部显示数值的效果
javascript
  option = {
    // 其他配置项...
    series: [{
        type: 'bar',
        data: [10, 20, 30, 40, 50],
        label: {
            show: true, // 显示数值
            position: 'inside' // 设置显示位置为柱状图内部
        }
    }]
};
👉** 设置柱状图顶部显示数字位置**
javascript
支持:top / left / right / bottom / inside / insideLeft / insideRight / insideTop / insideBottom / insideTopLeft / insideBottomLeft / insideTopRight / insideBottomRight也可以用一个数组表示相对的百分比或者绝对像素值表示标签相对于图形包围盒左上角的位置
js
  // 绝对的像素值
  position: [10, 10],
  // 相对的百分比
  position: ['50%', '50%']
👉** 设置柱状图顶部显示柱子的值**
option=> series => label
plain
label: {
    show: true,
    position: 'top',
    color: '#CCC',
},
👉** 更改柱状图顶部显示的值格式或者自定义**
javascript
label: {
  show: true,
  position: 'top',
  color: '#CCC',
  formatter: function (params) {
    return `${params.value} 次`;
  }
},
👉柱状图顶部提示tooltip
主要是option中tooltip的配置
tooltip格式(formatter属性)
javascript
tooltip: {
trigger: 'axis', // item
axisPointer: {
type: 'shadow'
},
formatter: function (params) {
// 设置柱状图顶部的提示框格式
return params[0].name + '<br/> ' + params[0].value + ' 件'; // 添加单位“件”
}
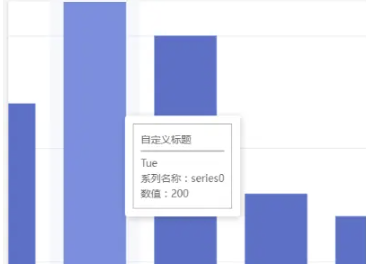
},自定义提示tooltip样式
javascript
  tooltip: {
      trigger: 'axis',
      axisPointer: {
          type: 'shadow'
      },
      // 自定义tooltip样式
      formatter: function (params) {
          var tooltipHtml = '';
          tooltipHtml += '<div style="background-color:rgba(255,255,255,0.8);border:1px solid #aaa;padding:10px;">';
          tooltipHtml += '<p style="margin:0;">自定义标题</p>';
          tooltipHtml += '<hr style="border:0.5px solid #aaa;margin:5px 0;">';
          tooltipHtml += '<p style="margin:0;">' + params[0].axisValue + '</p>';
          tooltipHtml += '<p style="margin:0;">系列名称:' + params[0].seriesName + '</p>';
          tooltipHtml += '<p style="margin:0;">数值:' + params[0].value + '</p>';
          tooltipHtml += '</div>';
          return tooltipHtml;
      }
  },
定义完成以后看看我们最后的效果:
自定义提示tooltip多类型柱子显示
js
  tooltip: {
        trigger: 'axis',
        axisPointer: {
            type: 'shadow'
        },
        // 自定义tooltip样式
        formatter: function (params) {
            var tooltipHtml = '';
            tooltipHtml += '<div style="background-color:rgba(255,255,255,0.8);border:1px solid #aaa;padding:10px;">';
            tooltipHtml += '<p style="margin:0;">自定义标题</p>';
            tooltipHtml += '<hr style="border:0.5px solid #aaa;margin:5px 0;">';
            for (var i = 0; i < params.length; i++) {
                tooltipHtml += '<p style="margin:0;">' + params[i].name + ':' + params[i].value + '</p>';
            }
            tooltipHtml += '</div>';
            return tooltipHtml;
        }
},👉左侧label为内部的时候如何去除数字为0
先来看看我们最后完成效果以后的缺陷:
这里我们重新用一下自定义数据就可以
js
  label: {
  show: true,
    position: 'insideRight',
    formatter: function(params) {
        return params.value !== 0 ? params.value : '';//这是关键,在需要的地方加上就行了
    }
  },
👉横向基准线
javascript
markLine: {
    silent: true, // 禁用交互效果,防止鼠标悬停时显示线条
    lineStyle: {
      color: '#00D35D', // 设置标记线的颜色
      width: 2, // 设置线条宽度
      type: 'solid' // 线条类型,可以是 'solid'、'dashed' 或 'dotted'
    },
    data: [
      {
        yAxis: 3, // 定义基准线所在的 Y 值为 3
        name: '安全基线' // 基准线的名称
      },
      {
        yAxis: 2, // 定义基准线所在的 Y 值为 3
        name: '安全基线' // 基准线的名称
      }
    ],
    label: {
      show: true, // 显示标签
      position: 'start', // 标签显示在起始位置
      formatter: '安全基线: {c}' // 格式化标签,{c}会显示基准线值
    }
}
3、x轴参数
👉x轴文字
option => xAxis: {}
plain
axisLabel: {
//文字的配置
  textStyle: {
    color: '#85C2FC' //Y轴内容文字颜色
  }
}
4、y轴参数
👉 设置坐标轴主线(axisLine)
javascript
option=> yAxis => axisLine
axisLine: {
    show: false, // 隐藏 Y 轴的刻度线
    lineStyle: {
      color: '#FF0000'  // 设置 X 轴主线的颜色为红色
    }
  }
👉 网格分割线颜色(splitLine)
javascript
option=> yAxis => splitLine
splitLine: {
  lineStyle: {
    color: '#85C2FC' // 设置 X 轴的分割线颜色为浅灰色
  }
}👉刻度线颜色(axisTick)
javascript
option=> yAxis => axisTick
axisTick: {
  lineStyle: {
    color: '#FF00FF'  // 设置 Y 轴刻度线的颜色为紫色
  }
}
👉y轴文字
option => yAxis: {}
plain
axisLabel: {
//文字的配置
  textStyle: {
    color: '#85C2FC' //Y轴内容文字颜色
  }
}
👉顶部数值
5、 特殊配置
👉横向柱状图设置
柱状图我也可以调成横躺之类的,我们可以先看看画面
效果图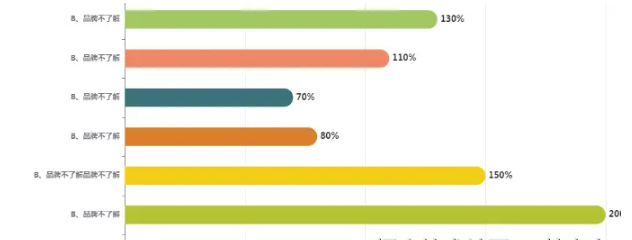
完整使用和配置,这里我们就直接上代码了!
plain
```js
option = {
  color: ['#1890FF'],

  textStyle: {
    fontSize: 14,
    fontStyle: 'normal',
    fontWeight: 'bold'
  },
  grid: {
    top: '5%',
    left: '20%',
    right: '4%',
    bottom: '16%',
    containLabel: true,
    borderWidth: 0,
    y: 80,
    y2: 60
  },
  xAxis: {
    type: 'value',
    // max:50,
    axisLine:{
      show:true,
      lineStyle: {
       color: '#fefef',
      },
    },
    axisLabel: {
      show: true,
      interval: 0,
      formatter: '{value} %' // 给每个数值添加%
    }
  },
  yAxis: {
     axisLine:{
      show:true,
      lineStyle: {
       color: '#fefef',
      },
    },
    type: 'category',
    data: [
      'A、价格过高',
      'B、品牌不了解',
      'B、品牌不了解品牌不了解',
      'B、品牌不了解',
      'B、品牌不了解',
      'B、品牌不了解',
      'B、品牌不了解'
    ]
  },
  series: [
    {
      itemStyle: {
        normal: {
          color: function (params) {
            // build a color map as your need.
            var colorList = [
              '#C1232B',
              '#B5C334',
              '#FCCE10',
              '#E87C25',
              '#27727B',
              '#FE8463',
              '#9BCA63',
              '#FAD860',
              '#F3A43B',
              '#60C0DD',
              '#D7504B',
              '#C6E579',
              '#F4E001',
              '#F0805A',
              '#26C0C0'
            ];
            return colorList[params.dataIndex];
          },
          label: {
            show: true,
            position: 'right',
            formatter: '{c}%' //这是关键,在需要的地方加上就行了
          },
          //设置柱子圆角
          barBorderRadius: [0, 20, 20, 0]
        },
        backgroundStyle: {
          color: '#EBEEF5'
        }
      },
      data: [20, 200, 150, 80, 70, 110, 130],
      type: 'bar',
      barWidth: 30 //柱图宽度
    }
  ]
};
👉左侧文字y轴距离y轴数字之间得距离
plain
yAxis=> axisLabel 部分
axisLabel: {
      margin: 20  // 如果需要,也可以调整 Y 轴标签与柱子之间的距离
},